Global Energy Landscape
The report acknowledges that while immediate pressures from the global energy crisis have eased, the energy markets, geopolitics, and the global economy remain unsettled with risks of further disruption. Fossil fuel prices have declined from their 2022 peaks, but markets are volatile. The report also highlights that the energy sector is a primary contributor to air pollution, affecting over 90% of the world’s population
Emergence of a Clean Energy Economy
- Investment in Clean Energy: Investment in clean energy technologies has risen by 40% since 2020. In 2023, more than USD 1 billion per day is being spent on solar deployment. The manufacturing capacity for key components like solar PV modules and EV batteries is also expanding rapidly.
- Electric Vehicle Adoption: In 2020, one in 25 cars sold was electric; by 2023, this figure has risen to one in five. This demonstrates a significant shift towards electric vehicles in the global market.
- Renewables Capacity Addition: Over 500 gigawatts (GW) of renewables generation capacity are set to be added in 2023, a record high.
Policy and Scenario Analysis
- Stated Policies Scenario (STEPS): This scenario projects a peak in global demand for coal, oil, and natural gas before 2030. The share of these fossil fuels in the global energy supply is projected to decrease from about 80% to 73% by 2030.
- Renewables in Policy Scenarios: In the United States, the Inflation Reduction Act is projected to result in 50% of new car registrations being electric by 2030. In the European Union, heat pump installations in 2030 are expected to reach two-thirds of the level needed in the NZE Scenario. China’s projected additions of solar PV and offshore wind to 2030 are now three times higher than previous estimates
Renewable Energy and Technological Innovations
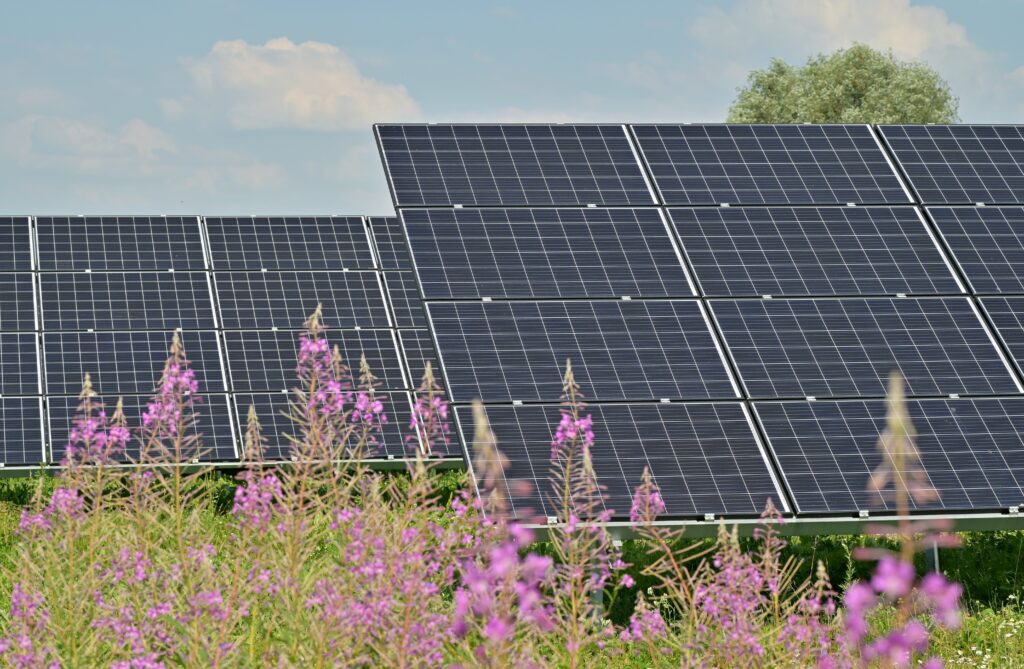
- Renewables Contribution: By 2030, renewables are set to contribute 80% of new power capacity, with solar PV alone accounting for more than half of this increase.
- Solar PV Manufacturing and Deployment: There is potential for the world to have a manufacturing capacity for more than 1,200 GW of solar panels per year by the end of the decade. However, only 500 GW is projected to be deployed globally in 2030 under current scenarios.
- Scaling Up Solar PV: Using 70% of anticipated solar PV manufacturing capacity would align with the NZE Scenario. In a sensitivity case, adding over 800 GW of new solar PV per year by 2030 could significantly reduce coal-fired generation, particularly in China, and also reduce fossil fuel-fired generation in regions like Latin America, Africa, Southeast Asia, and the Middle East.
Natural Gas and LNG Markets
- LNG Surge: Starting in 2025, a surge in new LNG projects is expected to significantly alter the balance of gas markets. These projects are set to add 250 billion cubic meters per year of liquefaction capacity by 2030, almost half of today’s global LNG supply. More than half of the new projects are in the United States and Qatar.
Challenges and Opportunities
- Energy Security and Clean Transitions: The global energy crisis has highlighted the importance of ensuring rapid and orderly transitions. Governments spent USD 900 billion in 2022 to shelter consumers from volatile fuel prices. The emphasis is on deploying cost-effective, clean technologies, especially in poorer households and countries.
- Energy Demand in Developing Economies: Emerging and developing economies, especially in Asia and Africa, are expected to see significant population growth, contributing to rising energy demand.
Pathways for Reducing Emissions
- Emissions Peak and Temperature Rise: The STEPS scenario sees a peak in energy-related CO₂ emissions in the mid-2020s, but the emissions remain high enough to push up global average temperatures to around 2.4 °C by 2100. To bend the emissions curve downwards, the report suggests tripling renewable energy capacity, doubling energy efficiency improvements, increasing electrification, and reducing methane emissions.
The world is witnessing a significant shift towards a clean energy economy, with renewable energy, particularly solar PV, and electric vehicles at the forefront. This transition is driven not just by climate concerns but also by economic and energy security factors. Government policies, such as the Inflation Reduction Act in the U.S., play a crucial role in accelerating the adoption of clean energy technologies and corporations should seek to take advantage of the financial incentives provided for renewables adoption while they can.
WatchWire by Tango is a market-leading, energy and sustainability data management platform that uses cloud-based software to collect, automize, and analyze utility, energy, and sustainability data metrics. WatchWire streamlines, automates, and standardizes your sustainability reporting process by integrating directly and/or providing reporting exports to ENERGY STAR Portfolio Manager, LEED Arc, GRESB, CDP, SASB, GRI, and more. The platform provides customizable dashboards, which allow asset managers, sustainability managers, engineers, and more to monitor individual key performance indicators (KPIs) and create custom views for specific use cases.
To discover more about WatchWire and its capabilities, you can visit our website, blog, or resource library, request a demo, or follow us on LinkedIn, Instagram, or Twitter to keep up-to-date on the latest energy and sustainability insights, news, and resources.
 Top Sustainability Trends to Watch in 2025

 Log In


