What is Interval Monitoring?
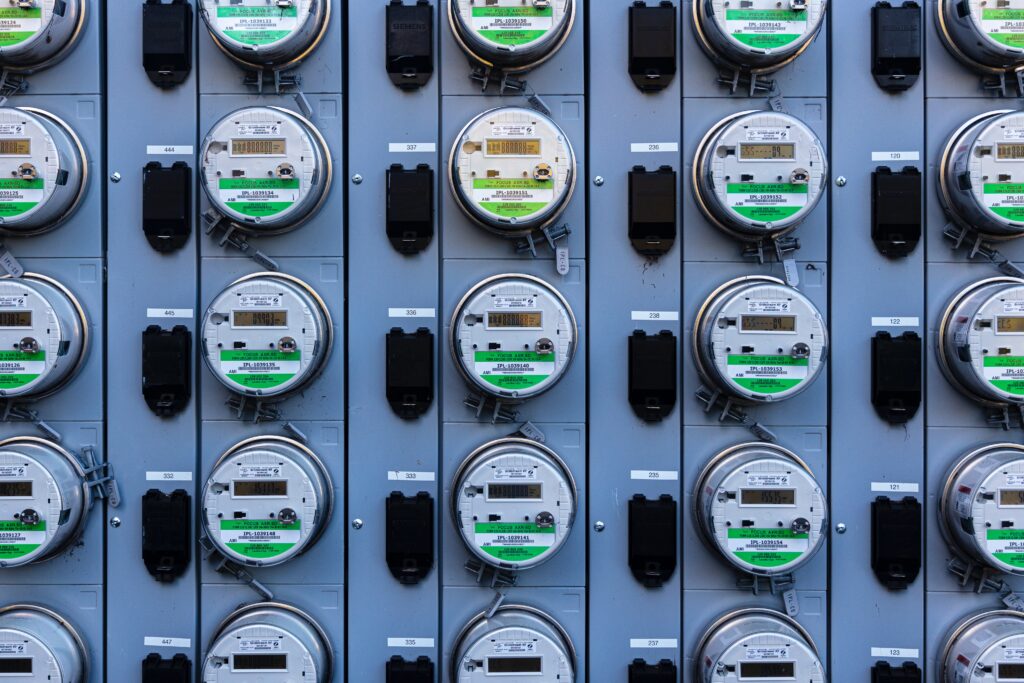
Interval data can come from a variety of sources; the energy supplier could provide the data from a smart meter, or interval meters can be installed separately by the building owners. It is typically measured every 15 minutes (or in 30 or 60-minute intervals), providing users with over 35,000 data points in a single year (compared to the 12 data points provided by only utility bill data) and generally available 24 hours after measurement. The US Department of Energy declares that the “value of interval data is the consistent recording of incremental use offering increased resolution and diagnostic capability.” Regardless of your energy consumption level, interval data provides the resources necessary to identify anomalies in your energy usage.
What is Real-Time Monitoring?
Interval data usually lags by some time interval, which can decrease the efficiency of understanding patterns in consumption data from the day before. Real-time data, as the name suggests, is available to access immediately. You will be able to look at what is going on in your building at any given moment as the data is collected from your meters several thousand times each second. Because real-time data offers real-time alerts, you will start to see significant changes in your utility bills if you can fix problems within the hour they occur, rather than a full day later (with interval data). If you have a problem with your HVAC system in the middle of the night on Tuesday, you want to be alerted immediately, so the temperature in the building can be regulated.
Real-time data is not a significantly more expensive solution than interval data, because energy meters have become increasingly cheaper and easier to install. Once the meters are installed, the data collection is easy.
Importance:
Would you want to wait an entire month to realize that your usage last month was higher than normal? That is what happens with normal utility bill data. To make matters worse, with utility bill data you do not know what exactly happened to cause the spike. Using utility bill data alone to analyze your energy consumption trends will not provide the necessary insight that could help you solve any efficiency issues in your energy and sustainability management plan. According to the General Services Administration, interval data can lead to savings up to 45% of overall utility expenses. Interval data monitored over just one day can provide immediate recommendations for operational shifts that could reduce costs on the current billing cycle, rather than waiting until the end of the month to trace back your business operations. Some more benefits of interval and real-time monitoring are:
- Learn what your building’s base load is: Base load is how much energy your building is using when it is “turned off”. Utility bill data does not tell you your base load in the way that real time data can. However, when you know your base load, you can save a lot of money by reducing it – turning off lights, computers and air conditioning when leaving for the day, etc.
- Scoping out inefficiencies in consumption: Real-time monitoring data is very detailed, down to the exact meter and time of the day that the spike occurred making anomalies easy to spot. You can ensure daily usage is meeting expectations with the use of real-time (e.g. lower usage on weekends and holidays vs. business days).
- Reducing excessive energy use: According to the DOE and the EPA, commercial buildings waste approximately 30% of the energy they use.
- Lighting: If the lighting systems in your building are old and inefficient, you may be losing a great deal of both energy and money. Real-time data can indicate whether your lighting system is consuming more energy than normal for the time the lights are on.
- Phantom Loads: Phantom loads, aka plug loads, are caused by leaving electronics plugged in when they are not in use. They can contribute up to 10% of your overall electric costs. Data monitoring is a useful way to pinpoint them. If the data shows unusually high energy use when your building is vacant and lights and devices are supposedly off, this is a sign that phantom loads are draining your energy.
- Faulty Controls: The controls on your heating system can have flaws that cause unnecessary energy spikes. For example, improperly functioning heat pumps operating solely on backup heat sources can increase your heating costs by as much as 40%. Boiler controls should also be regularly examined to ensure they’re running correctly. In many cases, a spike in energy use will be the first indication you receive that there is a problem with your system controls. Data monitoring can instantly alert you to just such changes.
- HVAC Systems: The heating, ventilation, and air conditioning (HVAC) system is usually one of the biggest areas of energy consumption within a facility. An HVAC system is comprised of ductwork and registers, fans and blowers, and various electrical connections. All of these can be areas where energy is lost. Data monitoring can be used to determine the status of your HVAC system.
- Equipment Maintenance: Ensuring proper equipment run time by comparing actual energy use to operating schedules and acting quickly to correct any inefficiencies.
- Managing peak demand better: Interval data allows you to effectively identify peak times to manage your demand and reduce monthly demand charges. You can examine which systems are running at the time of highest usage, and focus on key peak load management strategies to make them more efficient.
- Helping Sustainability measures succeed: Interval data provides a more detailed understanding of operational patterns. In turn, this detail allows you to set specific and meaningful sustainability goals and accurately track your efforts toward attaining those goals. This process of quantifying the energy and cost savings resulting from sustainability measures is called measurement and verification and real time/ interval utility data is the baseline for this process. Savings cannot be directly measured since they represent the absence of energy use. Instead, they are determined by comparing interval/real-time data before and after project implementation, making appropriate adjustments for changes in conditions.
How WatchWire Can Help
Before you can analyze your interval or real-time data, you need easy access to that data. Analysis can become challenging when dealing with a large portfolio of buildings serviced by multiple utility providers. However, an energy and sustainability management software should provide you with easy interpretations of your interval/real-time energy data. WatchWire, provides a single source for all interval and real-time data, offering multiple visuals for analysis and actionable insight through the Interval Data Analytics or Real-Time Monitoring modules.
WatchWire by Tango is a market-leading, energy and sustainability data management platform that uses cloud-based software to collect, automize, and analyze utility, energy, and sustainability data metrics. WatchWire streamlines, automates, and standardizes your sustainability reporting process by integrating directly and/or providing reporting exports to ENERGY STAR Portfolio Manager, LEED Arc, GRESB, CDP, SASB, GRI, and more. The platform provides customizable dashboards, which allow asset managers, sustainability managers, engineers, and more to monitor individual key performance indicators (KPIs) and create custom views for specific use cases.
To discover more about WatchWire and its capabilities, you can visit our website, blog, or resource library, request a demo, or follow us on LinkedIn, Instagram, or Twitter to keep up-to-date on the latest energy and sustainability insights, news, and resources.
 Top Sustainability Trends to Watch in 2025

 Log In


